Introduction
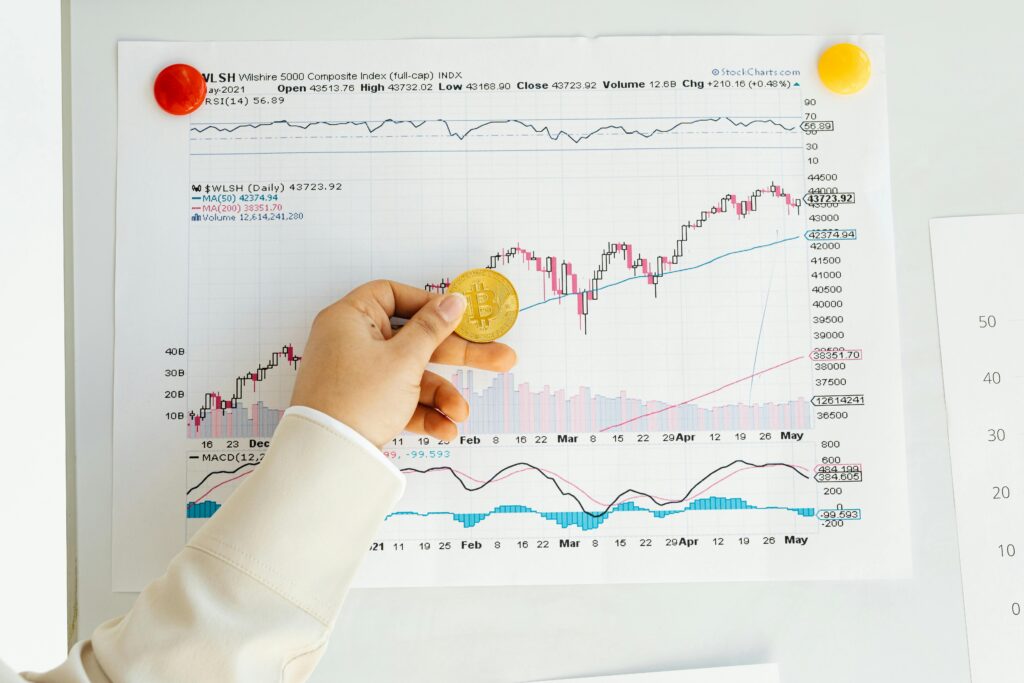
A Golden Crossover is one of the most popular and reliable bullish signals in the stock market. It occurs when a short-term moving average (like the 50-day) crosses above a long-term moving average (like the 200-day), signaling a potential upward trend. This technical pattern is widely used by traders and investors to identify the beginning of a long-term bull market.
What are Moving Averages?
Moving averages (MAs) are statistical tools used to smooth out price data and identify the direction of a trend. They help eliminate noise and provide a clearer picture of market movements.
Types of Moving Averages
-
Simple Moving Average (SMA):
- Calculates the average of closing prices over a specific period.
- Provides a straightforward measure of market trend.
-
Exponential Moving Average (EMA):
- Gives more weight to recent prices.
- Responds faster to price changes.
What is a Golden Crossover?
A Golden Crossover occurs when:
✅ The short-term moving average (e.g., 50-day) crosses above the long-term moving average (e.g., 200-day).
✅ It signals a strong upward trend and potential buying opportunity.
| Indicator | Description |
|---|---|
| Short-Term MA | 50-day moving average |
| Long-Term MA | 200-day moving average |
| Signal | Bullish (uptrend) |
How to Identify a Golden Crossover
- Technical Charts: Use platforms like TradingView or MetaTrader to monitor moving average crossovers.
- Timeframes: Most traders use 50-day and 200-day combinations for long-term signals.
- Volume Confirmation: Higher trading volume during the crossover adds strength to the signal.
Golden Crossover vs. Death Cross
| Feature | Golden Crossover | Death Cross |
|---|---|---|
| Direction | Bullish | Bearish |
| Short-Term MA | Crosses Above Long-Term MA | Crosses Below Long-Term MA |
| Signal Type | Buying Opportunity | Selling Opportunity |
Why the Golden Crossover is Important
- Reliable Bullish Indicator – Historically linked with long-term market gains.
- Institutional Influence – Large funds often adjust portfolios based on this signal.
- Momentum Building – Encourages increased market participation.
Benefits of Using Golden Crossover Strategy
✅ Provides clear buy signals
✅ Reduces market noise
✅ Works well in various market conditions
Challenges and Limitations
❌ False Signals in Volatile Markets
❌ Lagging Indicator – Reacts to past price movements
❌ May Mislead in Sideways Markets
Best Moving Average Combinations for Golden Crossover
| Moving Average Combination | Best For |
|---|---|
| 50-day & 200-day SMA | Long-Term Trends |
| 20-day & 50-day EMA | Short-Term Trading |
| 100-day & 200-day SMA | Medium-Term Trends |
Golden Crossover Strategy in Different Market Conditions
- Bullish Market: Provides strong confirmation for trend continuation.
- Bearish Market: May produce false signals.
- Sideways Market: Less reliable; use additional indicators.
How to Build a Golden Crossover Trading Strategy
- Set Moving Averages: Choose the right timeframes.
- Define Entry/Exit Points: Buy when crossover happens; exit when opposite signal forms.
- Confirm with Volume: Ensure volume rises during crossover.
- Adjust Strategy: Adapt to market volatility.
List of Golden Crossover stocks
Common Mistakes to Avoid
❌ Ignoring volume confirmation
❌ Overtrading based on minor crossovers
❌ Ignoring broader market conditions
Conclusion
The Golden Crossover is a powerful bullish signal that can provide valuable insights into market trends. By combining moving averages, volume analysis, and market context, traders can enhance the reliability of this strategy. However, it’s essential to avoid false signals and adapt the strategy to changing market conditions.
FAQs
1. What is the best timeframe for a Golden Crossover?
The 50-day and 200-day combination is widely used for long-term signals.
2. Can a Golden Crossover work in all markets?
Yes, but it’s more reliable in bullish markets.
3. How accurate is the Golden Crossover strategy?
It’s historically reliable, but confirmation with volume is essential.
4. What is the difference between a Golden Crossover and a Death Cross?
Golden Crossover signals bullish trends; Death Cross signals bearish trends.
5. How can I minimize false signals with a Golden Crossover?
Use volume confirmation and additional indicator
